Bullish Engulfing
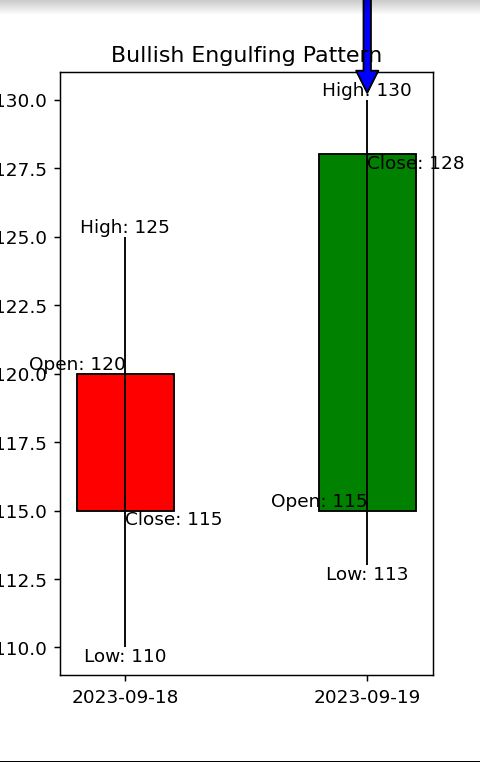
This is the candlestick signal that indicates a possible reversal in favor of the bullish.
It indicates that buyers are gaining control and it may be the best chance for you to consider buying.
However, it is important as a trader to consider other indicators such as RSI, MACD, and so on in the Technical Indicator option in the menu button.
Hammer
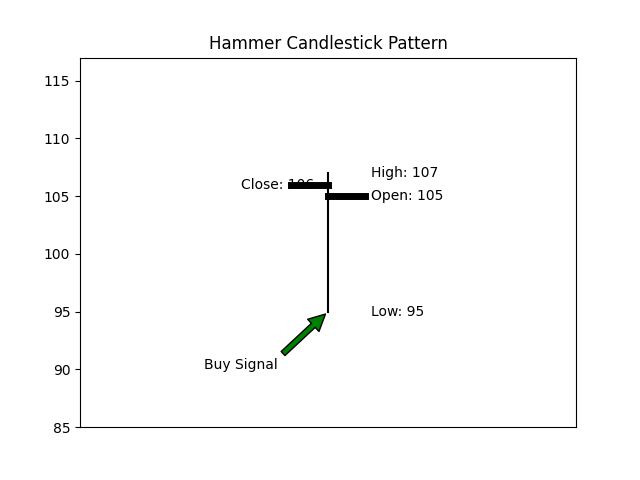
This is a candle stick that indicates a potential buy signal or bullish taking control
The long lower wick shows us that sellers took control first afterwards the buyers gained control with strength and pushed the sellers.
However it is important that as trader you consider other Indicators such as RSI, MACD etc. in the Technical Indicator option in menu button.
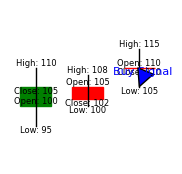
Percing Line
The candle stick indicates a buy signal.
It indicates that the buyers are gaining control over the sellers.
However, it is important as a trader to consider other indicators such as RSI, MACD, and so on in the Technical Indicator option in the menu button.
Morning Star
This signal indicates a possible reversal in favor of the bullish.
It shows that sellers are losing control and that there might be a possible chance to buy.
However, it is important as a trader to consider other indicators such as RSI, MACD, and so on in the Technical Indicator option in the menu button.
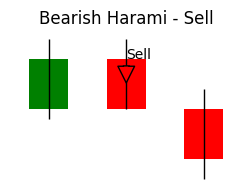
Bullish Harami
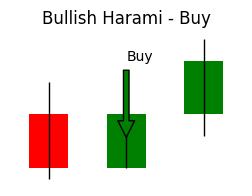
This is candle stick that indicates a buy signal.
It indicates a potential reversal in favor of the bullish as sellers lose control.
However, it is important as a trader to consider other indicators such as RSI, MACD, and so on in the Technical Indicator option in the menu button.
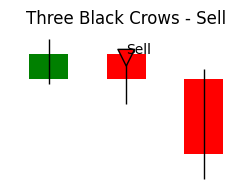
Three White Soldiers
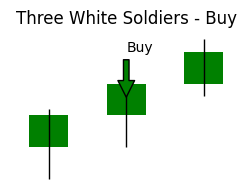
These candles indicate a strong buy position.
It shows that the buyers are strongly taking control of the market and there is a chance for an uptrend.
However, it is important as a trader to consider other indicators such as RSI, MACD, and so on in the Technical Indicator option in the menu button.
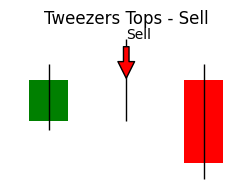
Tweezer Bottom
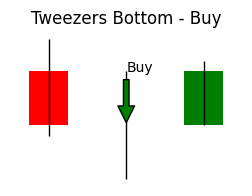
This candle indicates a buy signal in favor of the bullish.
It shows that the sellers are losing control on a downtrend and that there is a possible reversal.
However it is important that as trader you consider other Indicators such as RSI, MACD etc. in the Technical Indicator option in menu button.
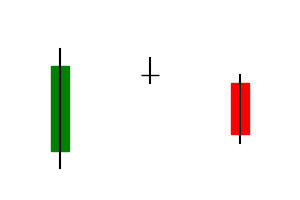
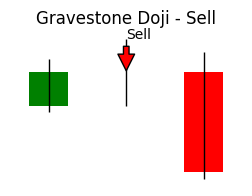
Doji
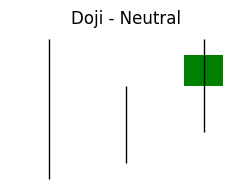
The Doji indicates the indecision of buyers and sellers, but when it appears at the end of a downward trend it indicates a potential reversal.
But I will insist that this potential buy signal must be combined with other technical Indicators for you to decide whether to buy.
Rising Three Methods

These are candle stick that indicates a buy signal.
It shows a that an uptrend with continues.
However, it is important as a trader to consider other indicators such as RSI, MACD, and so on in the Technical Indicator option in the menu button.
Abandoned Baby
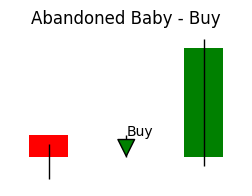
These candles indicate a buy signal in favor of the bullish.
It shows that there a possible reversal as buyers strength takes control after a gap indicated by the long bullish candle stick.
However it is important that as trader you consider other Indicators such as RSI, MACD etc. in the Technical Indicator option in menu button.